
Numbers do not lie, but they often mislead when viewed in isolation.
In our previous article on trade balances, we outlined which countries are running structural surpluses and which are absorbing the world’s exports through persistent deficits. Trade flows, however, only tell part of the story. To properly assess economic strength and vulnerability, you must add two structural pillars to the analysis: GDP size and government debt.
The data below is based on the October 2025 edition of the World Economic Outlook (October 2025) by the International Monetary Fund (IMF).
GDP reflects the total annual output of an economy. Debt to GDP shows how large a government’s accumulated debt is relative to that output. The combination of trade balance, economic size, and debt burden reveals far more than any single metric alone.
- United States: GDP approximately $29 trillion, trade deficit above $1 trillion, debt around 120% of GDP.
- China: GDP near $18 to $19 trillion, large structural trade surplus, government debt roughly mid 80% range of GDP.
- Euro Area: Combined GDP around $16 trillion, moderate trade surplus overall, debt near 90% of GDP.
- Japan: GDP roughly $4 trillion, debt exceeding 230% of GDP, persistent fiscal pressure.
- Low debt exporters: Russia and Saudi Arabia maintain debt ratios well below 30% while running trade surpluses.
Scale Matters: Who Produces the Most?
The United States remains the world’s largest economy at roughly $29 trillion in output. China follows at just under $19 trillion. The Euro Area collectively stands around $16 trillion, with Germany as its largest individual economy at roughly $4.5 trillion. Japan and India both operate in the $4 trillion range.
These figures put trade balances into perspective. A one trillion dollar deficit for the United States sounds dramatic, yet it represents a much smaller share of GDP than the same nominal deficit would for a mid sized economy. Scale provides resilience, but it does not eliminate risk.
Debt Load: Who Is Carrying the Weight?
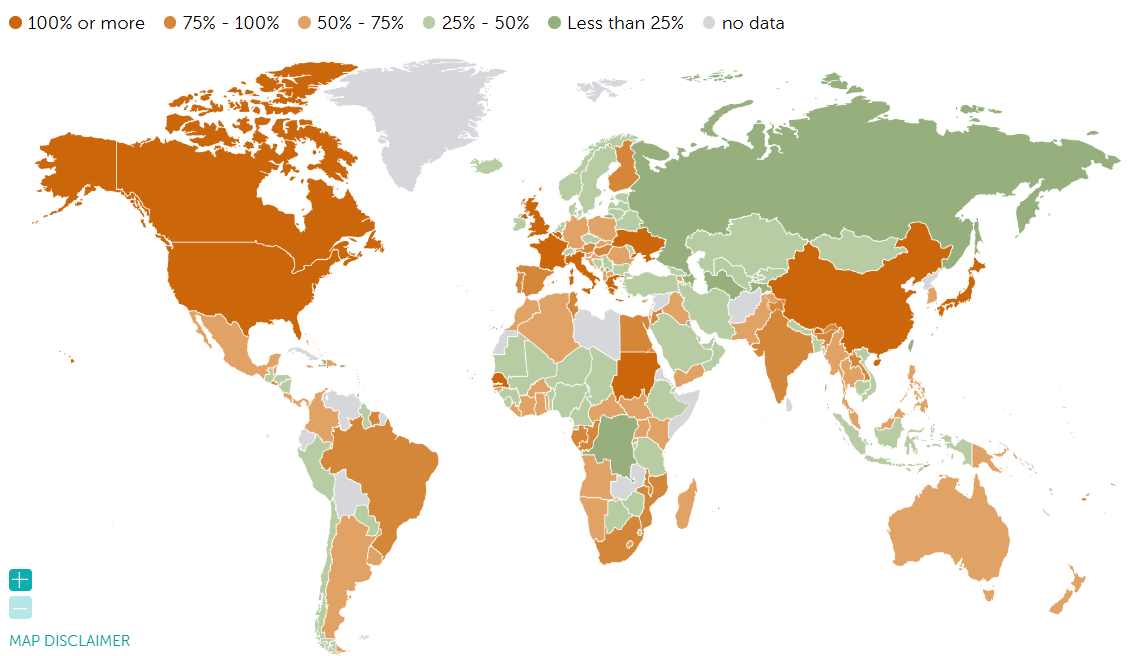
Debt to GDP ratios reveal fiscal flexibility. Japan remains the extreme case, with government debt exceeding 230% of GDP. The United States sits near 120%. France is above 110%, the United Kingdom around 100%, and the Euro Area average close to 90%.
China’s central government debt remains lower than most Western peers in percentage terms, roughly in the mid 80% range, though broader measures including local and corporate liabilities would increase that figure. By contrast, Russia operates near 15 to 20%, and Saudi Arabia below 30%.
The Dependency Equation
Trade balances create structural dependencies between nations. A deficit country depends on continuous foreign capital inflows to finance consumption. A surplus country depends on external demand to absorb its production.
The United States depends on global investors purchasing Treasury securities to fund both fiscal deficits and trade imbalances. China and Germany depend on foreign consumers, particularly in North America and Europe, to maintain export driven growth. Japan depends heavily on domestic financial institutions to absorb its massive public debt.
When high trade deficits align with high debt ratios, vulnerability increases. The United Kingdom, France, and the United States all combine persistent deficits with elevated debt levels. Rising interest rates magnify pressure in such systems. Conversely, Russia and Saudi Arabia combine surpluses with low sovereign debt, reducing fiscal strain, though their economies remain concentrated in commodities.
Surplus Does Not Mean Safety
Germany demonstrates a more balanced profile: trade surplus combined with moderate debt near 60% of GDP. That creates room for maneuver. Japan shows the opposite dynamic: manageable trade flows but extreme debt accumulation. The United States shows scale and financial dominance, yet rising debt servicing costs create long term constraints.
Emerging economies present a mixed picture. India runs a trade deficit but maintains debt below many Western peers in percentage terms. Indonesia and the UAE operate with comparatively lower debt burdens. Brazil and South Africa carry higher ratios while depending on commodity exports.
The Holistic View
Trade balance shows direction of flows. GDP shows capacity. Debt shows constraint.
A large economy can sustain imbalances longer than a small one. A low debt ratio offers flexibility in downturns. A surplus provides foreign income but can mask domestic leverage or overreliance on external demand. When deficits and high debt combine, the margin for error narrows.
The system looks strong. Until it does not.