

Global trade reached a record level in 2025. Total trade in goods and services exceeded $35 trillion, roughly $2.2 trillion more than in 2024. Growth remained positive throughout the year, although momentum slowed in the second half.
The data comes from the Global Trade Update (December 2025) published by UN Trade and Development. Beyond the record numbers, the report highlights a more important development. Trade growth is shifting toward manufacturing and technology, while imbalances between major economies remain large.
Trade balances reveal more than economic activity. They show dependence. Countries running large surpluses accumulate foreign income and financial power. Countries running persistent deficits rely on external production and capital flows.
- Global trade 2025: Above $35 trillion, record high
- Goods trade growth: about +6% year on year
- Services trade growth: about +9% year on year
- Trend: Growth slowed into 2026 while imbalances remain high
Who Earns and Who Depends
The largest trade surpluses remain concentrated in export-driven economies. These countries sell more abroad than they consume domestically, generating foreign currency inflows.
- China: current account surplus around $424B, largest globally
- Germany: roughly $250B surplus driven by manufacturing exports
- European Union overall: goods surplus around $461B
- Russia: large surplus supported by energy exports despite volatility
- Netherlands: large surplus driven by reexports and logistics
- Norway and Gulf exporters: energy driven surpluses
- Singapore and Vietnam: manufacturing and reexport hubs
Persistent surpluses allow countries to accumulate foreign assets and reduce external dependence. Deficit countries operate differently. They rely on continuous imports financed through capital inflows or debt.
The Largest Importers
The largest deficits are concentrated in large consumer economies where domestic demand exceeds domestic production.
- United States: roughly $918B deficit in goods and services, largest globally
- United Kingdom: large goods deficit partially offset by services exports
- India: persistent deficit driven by energy and industrial imports
- France and Italy: deficits linked to energy and consumer goods imports
- Turkey and Egypt: structural deficits tied to energy and food imports
Deficits are not inherently negative. They often reflect strong consumption or investment. However, long-term deficits increase external dependence, especially when financed through borrowing.
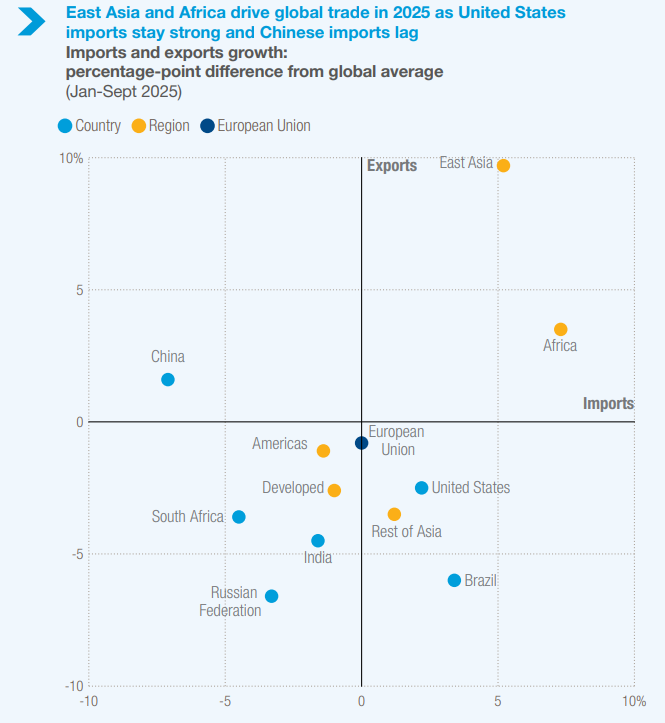
Where Growth Came From in 2025
Trade growth in 2025 was led by developing regions, particularly East Asia and Africa. Exports from developing economies grew around 8 percent over the past twelve months, roughly double the pace of developed economies.
South South trade expanded strongly, showing that global trade is becoming less dependent on a single demand center.
Manufacturing and Technology Take the Lead
- Manufacturing trade: about +10% over twelve months
- Electronics and ICT: strong growth supported by AI demand
- Semiconductors: continued expansion across major economies
- Agriculture: strong quarterly gains in cereals and food products
- Energy trade: declined due to falling fuel prices
- Automotive sector: overall weak performance
Technology and industrial production are increasingly central to global trade growth, while energy plays a smaller role than in previous cycles.
Dependence in a Fragmenting World
Trade patterns are also becoming more political. Trade between aligned countries increased again in 2025, while supply chains continued shifting toward regional partners.
Globalization is reorganizing. Countries are trying to reduce strategic dependence while maintaining economic efficiency. That creates a world where trade continues to grow, but relationships become more selective.
Outlook for 2026
The outlook for 2026 is more cautious. Slower economic growth, higher trade costs, geopolitical tensions and high debt levels are expected to limit expansion. Digital industries and environmental technologies may provide partial support, but overall growth is expected to moderate.
Who Depends on Whom
Trade balances ultimately describe dependence. Surplus countries depend on external demand. Deficit countries depend on external supply and capital. Understanding global trade therefore means understanding relationships.
The record year of 2025 confirms that global trade is not shrinking. It is shifting toward new regions, new sectors and new dependencies.
For deeper structural context behind these flows, read GDP and Debt Behind Global Trade Balances.
Learn how to trade with time, energy, and health.